Showing posts with label Azure Data Platform. Show all posts

Saturday, April 04, 2020

Data Platform Tips 87 - Azure SQL Analytics

Azure SQL Analytics provides ability to monitor all Azure SQL Databases (single, pooled, managed instances and managed instance databases) using a single view. It is a cloud only monitoring solution and doesn't support monitoring SQL Server databases hosted on-premises or in virtual machines.

Azure SQL Analytics provides 2 views with the following functionality.

View for monitoring Databases and Elastic pools


View for monitoring Managed instances and Managed instance databases


The tiles in Azure SQL Analytics will be populated only if the Diagnostics logs for the Azure SQL Databases are configured to be sent to Log Analytics. With Azure SQL Analytics you will be able to monitor SQL errors, timeouts, blocks, database waits, query duration, CPU usage, Data IO usage, Log IO usage and Query waits statistics.


In the next post, we will look at how to provision and configure Azure SQL Analytics.

Friday, February 21, 2020

Data Platform Tips 86 - Clustered Columnstore indexes

Many relational databases physically store data as sets of rows, where all the data for a row is located together. This behavior is common for many OLTP systems. For large analytical workloads it is good to use a columnstore index to organize and access the data by column.

A clustered columnstore index physically reorganizes a table. The data is divided into a series of rowgroups of up to 1 million rows (approximately) that are compressed to improve I/O performance. When querying data by column, the data warehouse simply needs to read the column segments for that column. Decompression is performed quickly in memory, and the results returned to the query.

With clustered columnstore index over a table, entire table is indexed.

CREATE TABLE clusteredColumnstoreTable

(

id int NOT NULL,

firstName varchar (50),

lastName varchar (50),

zipCode varchar (10)

)

WITH (CLUSTERED COLUMNSTORE INDEX);

More information - https://docs.microsoft.com/en-nz/sql/relational-databases/indexes/columnstore-indexes-overview?view=sql-server-ver15

Thursday, February 20, 2020

Data Platform Tips 85 - Clustered and Nonclustered Indexes

The purpose of adding indexes to database tables is to increase the speed of retrieving data from these tables. An index contains key values that are created from one or more columns from a database table.

There are two different types of indexes:
  • Clustered indexes
  • Nonclustered indexes
Clustered indexes essentially dictate the way data rows are sorted and stored physically in that sorted order when inserted into a table. Clustered indexes are good for quickly retrieving a range of rows based on the key values—because the table is already sorted, based on those key values.


CREATE CLUSTERED INDEX Idx1 ON dbo.Employee (EmployeeID)

GO

Nonclustered indexes do not alter the way in which the data rows are stored in a table.
Nonclustered indexes are created as separate objects from the database table and have pointers back to the data rows in the table.

CREATE NONCLUSTERED INDEX IX_ProductVendor_VendorID 
    ON Purchasing.ProductVendor (BusinessEntityID);

More Information - https://docs.microsoft.com/en-us/sql/relational-databases/indexes/clustered-and-nonclustered-indexes-described?view=sql-server-ver15

Wednesday, February 19, 2020

Data Platform Tips 84 - Clustered Columnstore Index

A clustered columnstore index physically reorganizes a table. The data is divided into a series of rowgroups of up to 1 million rows (approximately) that are compressed to improve I/O performance; the greater the compression ratio, the more data is retrieved in a single I/O operation. This index uses column-based data storage and query processing to achieve gains up to 10 times the query performance in the Data Warehouse.

Each rowgroup is then divided into a set of column segments, one segment for each column. The contents of each column segment are stored together. When querying data by column, the data warehouse simply needs to read the column segments for that column. Decompression is performed quickly in memory, and the results returned to the query.

Note: when you create a clustered columnstore index over a table, you don’t specify which columns to index; the entire table is indexed.

More info - https://docs.microsoft.com/en-nz/sql/relational-databases/indexes/columnstore-indexes-overview?view=sql-server-ver15

CREATE TABLE clusteredColumnstoreTable

(

id int NOT NULL,

firstName varchar (50),

lastName varchar (50),

zipCode varchar (10)

)

WITH (CLUSTERED COLUMNSTORE INDEX);

Tuesday, February 18, 2020

Data Platform Tips 83 - Data Warehouse Units

A SQL pool represents a collection of analytic resources that are being provisioned when using SQL Analytics. Data Warehouse Unit (DWU) is a unit of measure of resources (CPU, memory and IOPS) assigned to the analytic resources. The analytic resources can be scale out or scale back compute by adjusting the data warehouse units setting.

For higher performance, you can increase the number of data warehouse units. For less performance, reduce data warehouse units.

Note: Storage and compute costs are billed separately, so changing data warehouse units does not affect storage costs.

Workload Management - https://docs.microsoft.com/en-us/azure/sql-data-warehouse/resource-classes-for-workload-management

Memory and Concurrency limits - https://docs.microsoft.com/en-us/azure/sql-data-warehouse/memory-concurrency-limits

Monday, February 17, 2020

Data Platform Tips 82 - Heap tables in Azure Synapse Analytics

Heap table is a special type of database table that enables faster loading of data. Enables faster loading of data in staging tables before any transformation for Data Warehouses. Heap tables are better than tables that has clustered or nonclustered indexes as loading data is slower than heap tables.

A heap table doesn't have any specific ordering and it is simply set of rows. If a table has less than 100 million rows it is recommended to create a heap table and load the data in Data Warehouse. Once data is loaded to the heap table then add the indexes required.

CREATE TABLE heapTable

(

id int NOT NULL,

firstName varchar (50),

lastName varchar (50),

zipCode varchar (10)

)

WITH (HEAP);

Sunday, February 16, 2020

Data Platform Tips 81 - Azure Synapse Analytics - Distribution Strategies

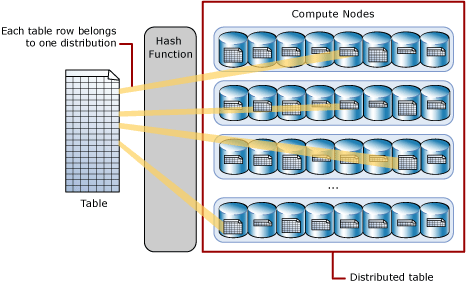
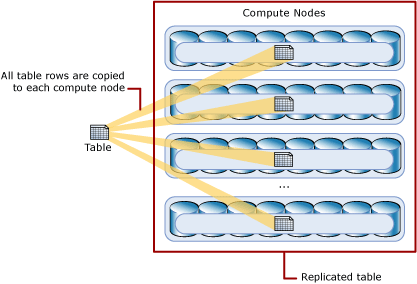
Azure Synapse Analytics (formerly known as Azure SQL Data Warehouse) uses three ways to distribute data. A distribution is the basic unit of storage and processing for parallel queries that run on distributed data. When SQL Analytics runs a query, the work is divided into 60 smaller queries that run in parallel using massively parallel processing (MPP) engine.

  • Round robin
  • Hashing
  • Replication

Round robin: Data is spread evenly among all the 60 underlying distributions without any regard to data values. There is no specific key used to distribute data.

Hashing: Most common and effective data distribution method. Data is distributed according to the most common distributed according to the value of a selected column.
Distributed table

Replication: Data is copied to every database rather than being split up. Replication is good small lookup tables or dimension tables that are frequently joined with other big tables.
Replicated table

Saturday, February 15, 2020

Data Platform Tips 80 - Data Virtualization using PolyBase

One of the key scenarios for SQL Server 2019 is the ability to virtualize data. This process allows the data to stay in its original location and still virtualize the data in a SQL Server instance so that it can be queried there like any other table in SQL Server. This is possible using PolyBase connectors.

PolyBase enables SQL Server to process Transact-SQL queries that read data from external data sources.

With SQL Server 2016 and above PolyBase was able to access data in Hadoop and Blob storage alone. Starting in SQL Server 2019,

PolyBase can be used to access external data in SQL Server, Oracle, Teradata, and MongoDB.

PolyBase enables

  • Query data stored in Hadoop from SQL Server
  • Query data stored in Azure Blob Storage
  • Import data from Hadoop, Azure Blob Storage, or Azure Data Lake Store
  • Export data to Hadoop, Azure Blob Storage, or Azure Data Lake Store
  • Integrate with BI tools

Friday, February 14, 2020

Data Platform Tips 79 - Job Diagram in Azure Stream Analytics for Debugging

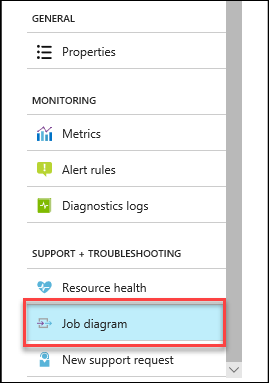
Job diagram with metrics - locationOne of the way to Debug your Azure Stream Analytics Query is using Job Diagram via the Azure Portal. The job diagram gives a helpful visual representation of the Stream Analytics job that is used to identify issues and bottlenecks quickly. 
  • On the Stream Analytics job in the Azure portal, click Job diagram in the SUPPORT + TROUBLESHOOTING section on the left pane.
  • View the metrics for each query step by selecting the query step in the diagram
  • To view the metrics for partitioned inputs or outputs, select the ellipses (…) on the input or
  • output then select Expand partitions.
  • Click a single partition node to view the metrics for that partition.
  • Click the merger node to view the metrics for the merger.


Wednesday, February 12, 2020

Data Platform Tips 77 - Azure Stream Analytics on IoT Edge

Azure Stream Analytics (ASA) on IoT Edge empowers developers to deploy near-real-time analytical intelligence closer to IoT devices. Enterprises can now deploy control logic close to the industrial operations and complement Big Data analytics done in the cloud using ASA on IoT Edge.

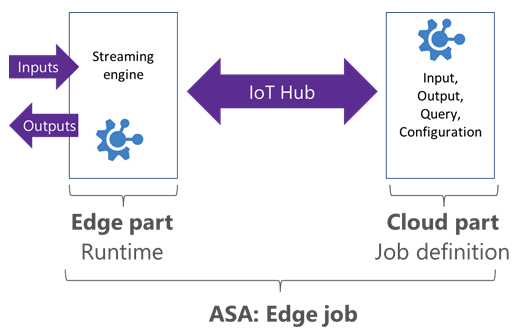
Azure Stream Analytics Edge jobAzure Stream Analytics on IoT Edge runs within the Azure IoT Edge framework.

ASA Edge jobs run in containers deployed to Azure IoT Edge devices.

They are composed of two parts:

  • Cloud part responsible for job definition: users define inputs, output, query, and other settings (out of order events, etc.)
  • A module running on your IoT devices containing the ASA engine and receives the job definition from the cloud.
ASA uses IoT Hub to deploy edge jobs to devices. Refer to IoT Edge Deployments

More information on IoT Edge - https://docs.microsoft.com/en-us/azure/iot-edge/about-iot-edge

Tuesday, February 11, 2020

Data Platform Tips 76 - Metrics to monitor on Azure Stream Analytics

Azure Stream Analytics Job need to be monitored for resource consumption and error handling scenarios and it is a good practice to monitor the following metrics that will assist in trouble shooting the jobs.

MetricDescription
Backlogged Input Events
Number of input events that are backlogged. A non-zero value for this metric implies that your job can’t keep up with the number of incoming events. If this value is slowly increasing or consistently non-zero, you should scale out your job.
Data Conversion Errors
Number of errors that the Stream Analytics job encountered when attempting to convert data types.
Early Input Events
Events whose application timestamp is earlier than their arrival time by more than 5 minutes.
Failed Function Requests
Number of failed Azure Machine Learning function calls (if applicable).
Function Events
Number of events sent to the Azure Machine Learning function (if applicable).
Function Requests
Number of calls to the Azure Machine Learning function (if applicable).
Input Deserialization Errors
Number of input events that could not be deserialized.
Input Event Bytes
Amount of data received by the Stream Analytics job, in bytes. This can be used to validate that events are being sent to the input source.
Input Events
Number of records deserialized from the input events. This count does not include incoming events that result in deserialization errors.
Input Sources Received
Number of messages received by the job. For Event Hub, a message is a single EventData. For Blob, a message is a single blob.
Late Input Events
Events that arrived later than the configured late arrival tolerance window.
Out-of-Order Events
Number of events received out of order that were either dropped or given an adjusted timestamp, based on the Event Ordering Policy.
Output Events
Amount of data sent by the Stream Analytics job to the output target, in number of events.
Runtime Errors
Total number of errors related to query processing (excluding errors found while ingesting events or outputting results)
SU % Utilization
The utilization of the Streaming Unit(s) assigned to a job from the Scale tab of the job. Should this indicator reach 80%, or above, there is high probability that event processing may be delayed or stopped making progress.
Watermark Delay
The maximum watermark delay across all partitions of all outputs in the job.

Monday, February 10, 2020

Data Platform Tips 75 - States of Azure Stream Analytics Job

Stream Analytics job could be in one of the below four states at any given time: running, stopped, degraded, or failed.

Running - Stream Analytics job is running on Azure reading events coming from the defined input sources, processing them and writing the results to the configured output sinks.

Stopped - Stream Analytics job is stopped and does not process events.

Degraded - There might be intermittent issues with the input and output connections which may result in transient errors and the job enters Degraded state. These errors may be due to network issues, availability of other Azure resources, deserialization errors etc.

Failed - Stream Analytics job encountered a critical error resulting in a failed state. Events aren't read and processed. Runtime errors are a common cause for jobs ending up in a failed state.

Sunday, February 09, 2020

Data Platform Tips 74 - Handling events reliably in Azure Stream Analytics

When handling temporal data streams, there may be situation where the events in the stream are not received in order or are received late.

In order to handle the events that are out of order or late arriving, Event Ordering policies can be set, which consist of a late arrival tolerance window, an out of order tolerance window, and an action.

Late arrival tolerance window — the Stream Analytics job will accept late events with a timestamp that is in the specified window.

Out of order tolerance window — the Stream Analytics job will accept out of order events with a timestamp that is in the specified window.

Action — the Stream Analytics job will either Drop an event that occurs outside the acceptable window, or Adjust the timestamp to the latest acceptable time.

Error policy

Azure Stream Analytics output error policy locationWhen processing streaming data, there may be reasons where a Stream Analytics job fails to write to the output sometimes. To fix this, output data error handling policies can be configured in Azure Stream Analytics.

The Error policy can be set by choosing either

  • Drop — drops any events that cause errors when writing to the output.
  • Retry — retries writing to the output until the event succeeds.

Saturday, February 08, 2020

Data Platform Tips 73 - Protecting Stream Analytics jobs

Most Azure services, including Stream Analytics, are managed by the Azure Resource Manager (ARM) API. This API includes how users and groups are granted access to interact with services, called Access Control (IAM). Role-Based Access Control (RBAC) is used to grant access to ARM resources.

Three main RBAC roles are

  • Owner - Provides access to manage everything about the resource, including access.
  • Contributor - Provides access to manage everything about the resource except for access.
  • Reader - Provides access to view all information about the resource, but not change anything.
Other roles include

  • Log analytics contributor - Provides access to read all monitoring data and edit monitoring settings, including settings for Azure Log Analytics and Diagnostics.
  • Log analytics reader - Provides access to read all monitoring data, including settings for Azure Log Analytics and Diagnostics.
  • Monitoring Contributor - Provides access to read all monitoring data and edit monitoring settings.
  • Monitoring Reader - Provides access to read all monitoring data.
  • User access Administrator - Provides access to manage user and group access to the resource.

Friday, February 07, 2020

Data Platform Tips 72 - What are Streaming Units?

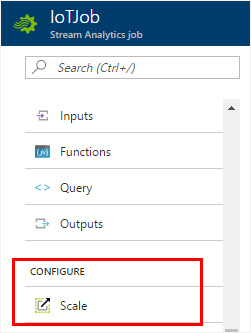
Azure portal Stream Analytics job configurationStreaming Units (SUs) are computing resources required to execute a Stream Analytics job. The computing resources are a combination of the measure of CPU, memory, and read/write rates.

SUs can be set as 1, 3, 6, and up in increments of 6. The maximum number of SUs that the streaming job can use can be determined by looking at the input, output, and query.

For queries that do not have any partitioned steps (not using PARTITION BY), the maximum number of SUs is six. For partitioned queries (using PARTITION BY), the maximum number of SUs for the job is calculated by multiplying the number of partitions by the number of partitioned steps, by six SUs for a single step.

By default, each Azure subscription has a quota of up to 500 SUs for all the analytics jobs in a specific region. To increase SUs for your subscriptions beyond this quota, contact Microsoft Support.

Thursday, February 06, 2020

Data Platform Tips 71 - Windowing functions in Azure Stream Analytics

Windowing function must be used in Azure Stream Analytics when using aggregate functions and GROUP BY clause. Stream Analytics provides four windowing functions. They are


  • Sliding Window
  • Tumbling Window
  • Hopping Window
  • Session Window


Sliding windows consider all possible windows of the given length. To make the number of windows manageable for Stream Analytics, sliding windows produce an output only when an event enters or exits the window. Every window has at least one event, and each event can be in more than one sliding window. Sliding windows overlap.


Tumbling windows are fixed-size windows that do not overlap and are contiguous. When the timespan of the window size has passed, a new window is immediately created with the same duration.


Hopping windows are used to specify overlapping windows that are scheduled. Hopping windows are defined with a windowsize, hopsize, and timeunit.


Session window functions group events that arrive at similar times, filtering out periods of time where there is no data.

Wednesday, February 05, 2020

Data Platform Tips 70 - Transformation Query in Azure Stream Analytics

Stream Analytics transformation query helps to select data from one or many inputs into one or many outputs. The query language is similar to T-SQL but differs in how the query is executed.

Stream Analytics Query Language Reference - https://docs.microsoft.com/en-nz/stream-analytics-query/stream-analytics-query-language-reference

Even though a single Stream Analytics job can have multiple inputs and multiple outputs, it is better to split unrelated queries into multiple Stream Analytics jobs. This will help in improving the performance of the jobs.

The following aggregate functions in Stream Analytics job.

  • AVG
  • COUNT
  • Collect
  • CollectTOP
  • MAX
  • MIN
  • Percentile_Cont
  • Percentile_Disc
  • STDEV
  • STDEVP
  • SUM
  • TopOne
  • VAR
  • VARP

Tuesday, February 04, 2020

Data Platform Tips 69 - Outputs supported in Azure Stream Analytics

Azure Stream Analytics integrates with many types of output. These outputs can be persistent storage, queues for further data processing, or Power BI for reporting of the streaming dataset. You can stream the data to multiple outputs as required. Outputs can also be in CSV, JSON or ARVO format.

The following outputs are supported with Azure Stream Analytics.

  • Event Hub
  • SQL Database
  • Blob Storage/Data Lake Storage Gen2
  • Table Storage
  • Service Bus Topic
  • Service Bus Queue
  • Cosmos DB
  • Power BI
  • Data Lake Storage Gen1
  • Azure Function

Monday, February 03, 2020

Data Platform Tips 68 - Inputs supported in Azure Stream Analytics

Stream Analytics is a managed Azure service for processing large amounts of streaming data coming from Azure Event Hubs or Azure IoT Hubs or Azure Blob storage. All Stream Analytics jobs have a basic structure of
  • Input(s), 
  • Transformation Query and 
  • Output(s)

Stream Analytics has integration with three kinds of input resources.

a) Azure Event Hubs
b) Azure IoT Hub
c) Azure Blob storage

These inputs can be in the same Azure subscription of the Stream Analytics job or also from a different subscription.

Inputs in Azure Stream Analytics is of 2 types.

Data stream input

A data stream is an unbounded sequence of events over time. Stream Analytics jobs must include at least one data stream input. Event Hubs, IoT Hub, and Blob storage are supported as data stream input sources.''

Reference data input

Stream Analytics also supports input known as reference data. Reference data is either completely static or changes slowly. Azure Blob storage and Azure SQL Database are currently supported as input sources for reference data.

Sunday, February 02, 2020

Data Platform Tips 67 - Azure HDInsight Availability Infrastructure

HDInsight provides four primary services to ensure high availability with automatic failover capabilities:

  • Apache Ambari server
  • Application Timeline Server for Apache YARN
  • Job History Server for Hadoop MapReduce
  • Apache Livy

These infrastructure consists of a number of services and software components, some of which are designed by Microsoft. The following components are unique to the HDInsight platform:

  • Slave failover controller
  • Master failover controller
  • Slave high availability service
  • Master high availability service

There are also other high availability services, which are supported by open source Apache reliability components. These components are also present on HDInsight clusters:
  • Hadoop File System (HDFS) NameNode
  • YARN ResourceManager
  • HBase Master