One of the way to Debug your Azure Stream Analytics Query is using Job Diagram via the Azure Portal. The job diagram gives a helpful visual representation of the Stream Analytics job that is used to identify issues and bottlenecks quickly.
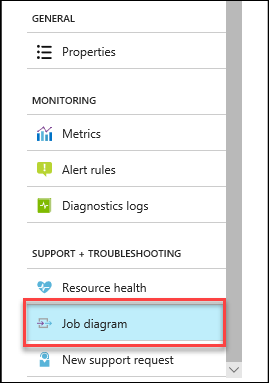
- On the Stream Analytics job in the Azure portal, click Job diagram in the SUPPORT + TROUBLESHOOTING section on the left pane.
- View the metrics for each query step by selecting the query step in the diagram
- To view the metrics for partitioned inputs or outputs, select the ellipses (…) on the input or
- output then select Expand partitions.
- Click a single partition node to view the metrics for that partition.
- Click the merger node to view the metrics for the merger.

No comments:
Post a Comment